Internal Concept
Tracer
A PostgreSQL observability platform designed to help developers identify performance issues through workflow-first monitoring rather than dashboard overload.
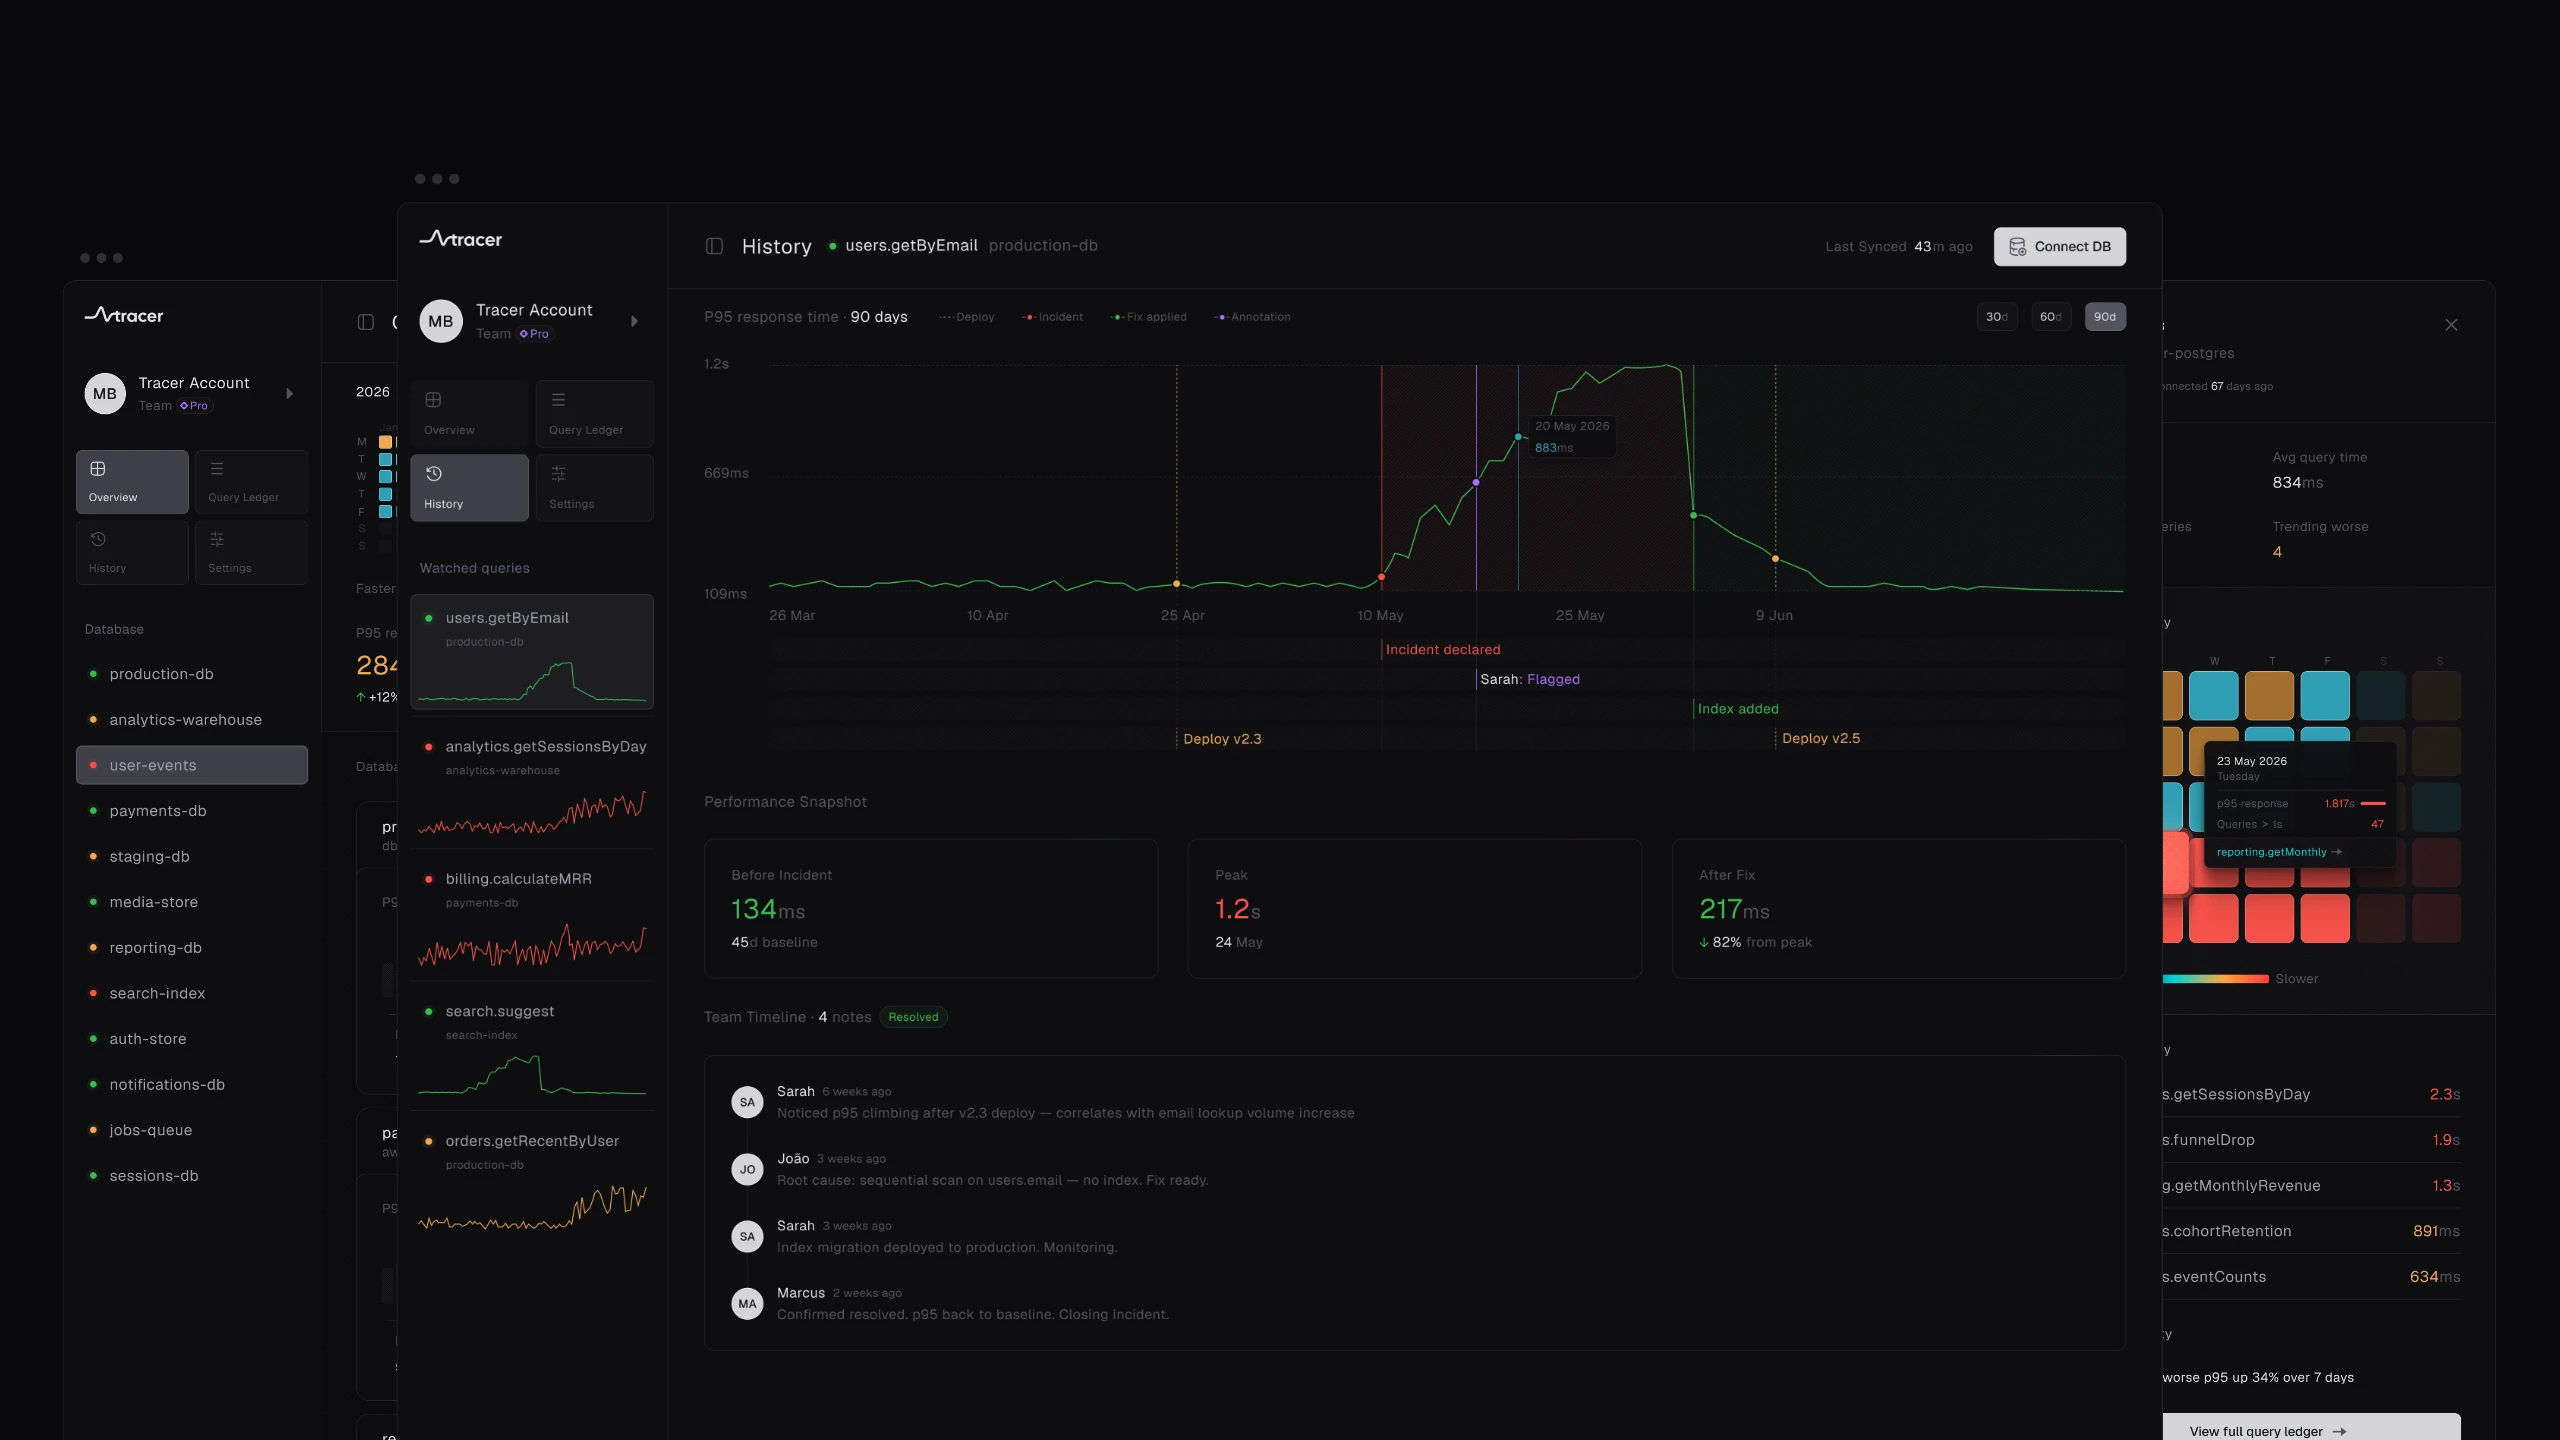
Project overview
Client
Internal Research
Industry
Developer Tools
Role
Product Design
Duration
3 Weeks
Tracer began with a simple question, what would PostgreSQL performance tooling look like if the interface was treated with the same care as the engineering behind it?
Existing monitoring platforms either target large enterprises with complex infrastructure or expose raw metrics that require deep database expertise to interpret. Independent developers and small engineering teams are often left without a clear understanding of what's changing, what's slowing down, or where attention is needed.
The objective was to design an observability platform that reduces cognitive overhead by organising performance data around engineering workflows rather than collections of dashboards.
Challenge
Database monitoring tools frequently optimise for data density rather than decision making. Engineers are expected to interpret multiple charts, logs and alerts before identifying a performance issue.
The challenge wasn't displaying more information it was making complex performance data immediately understandable while preserving the depth experienced users expect.
Design Principles
Workflow before dashboards
Organise around tasks, not metrics.
Surface meaning before numbers
Communicate change before detail.
Consistency through shared interaction
One interaction model throughout.
Key Decisions
Performance history as a heatmap
Rather than presenting a wall of charts, performance history is introduced through a yearly heatmap. Engineers can identify anomalies in seconds before drilling into individual metrics.

Thresholds drive the interface
Status indicators are calculated rather than decorative. Healthy, Warning and Critical states share the same threshold model across badges, alerts and summaries, ensuring every status communicates the same underlying logic.
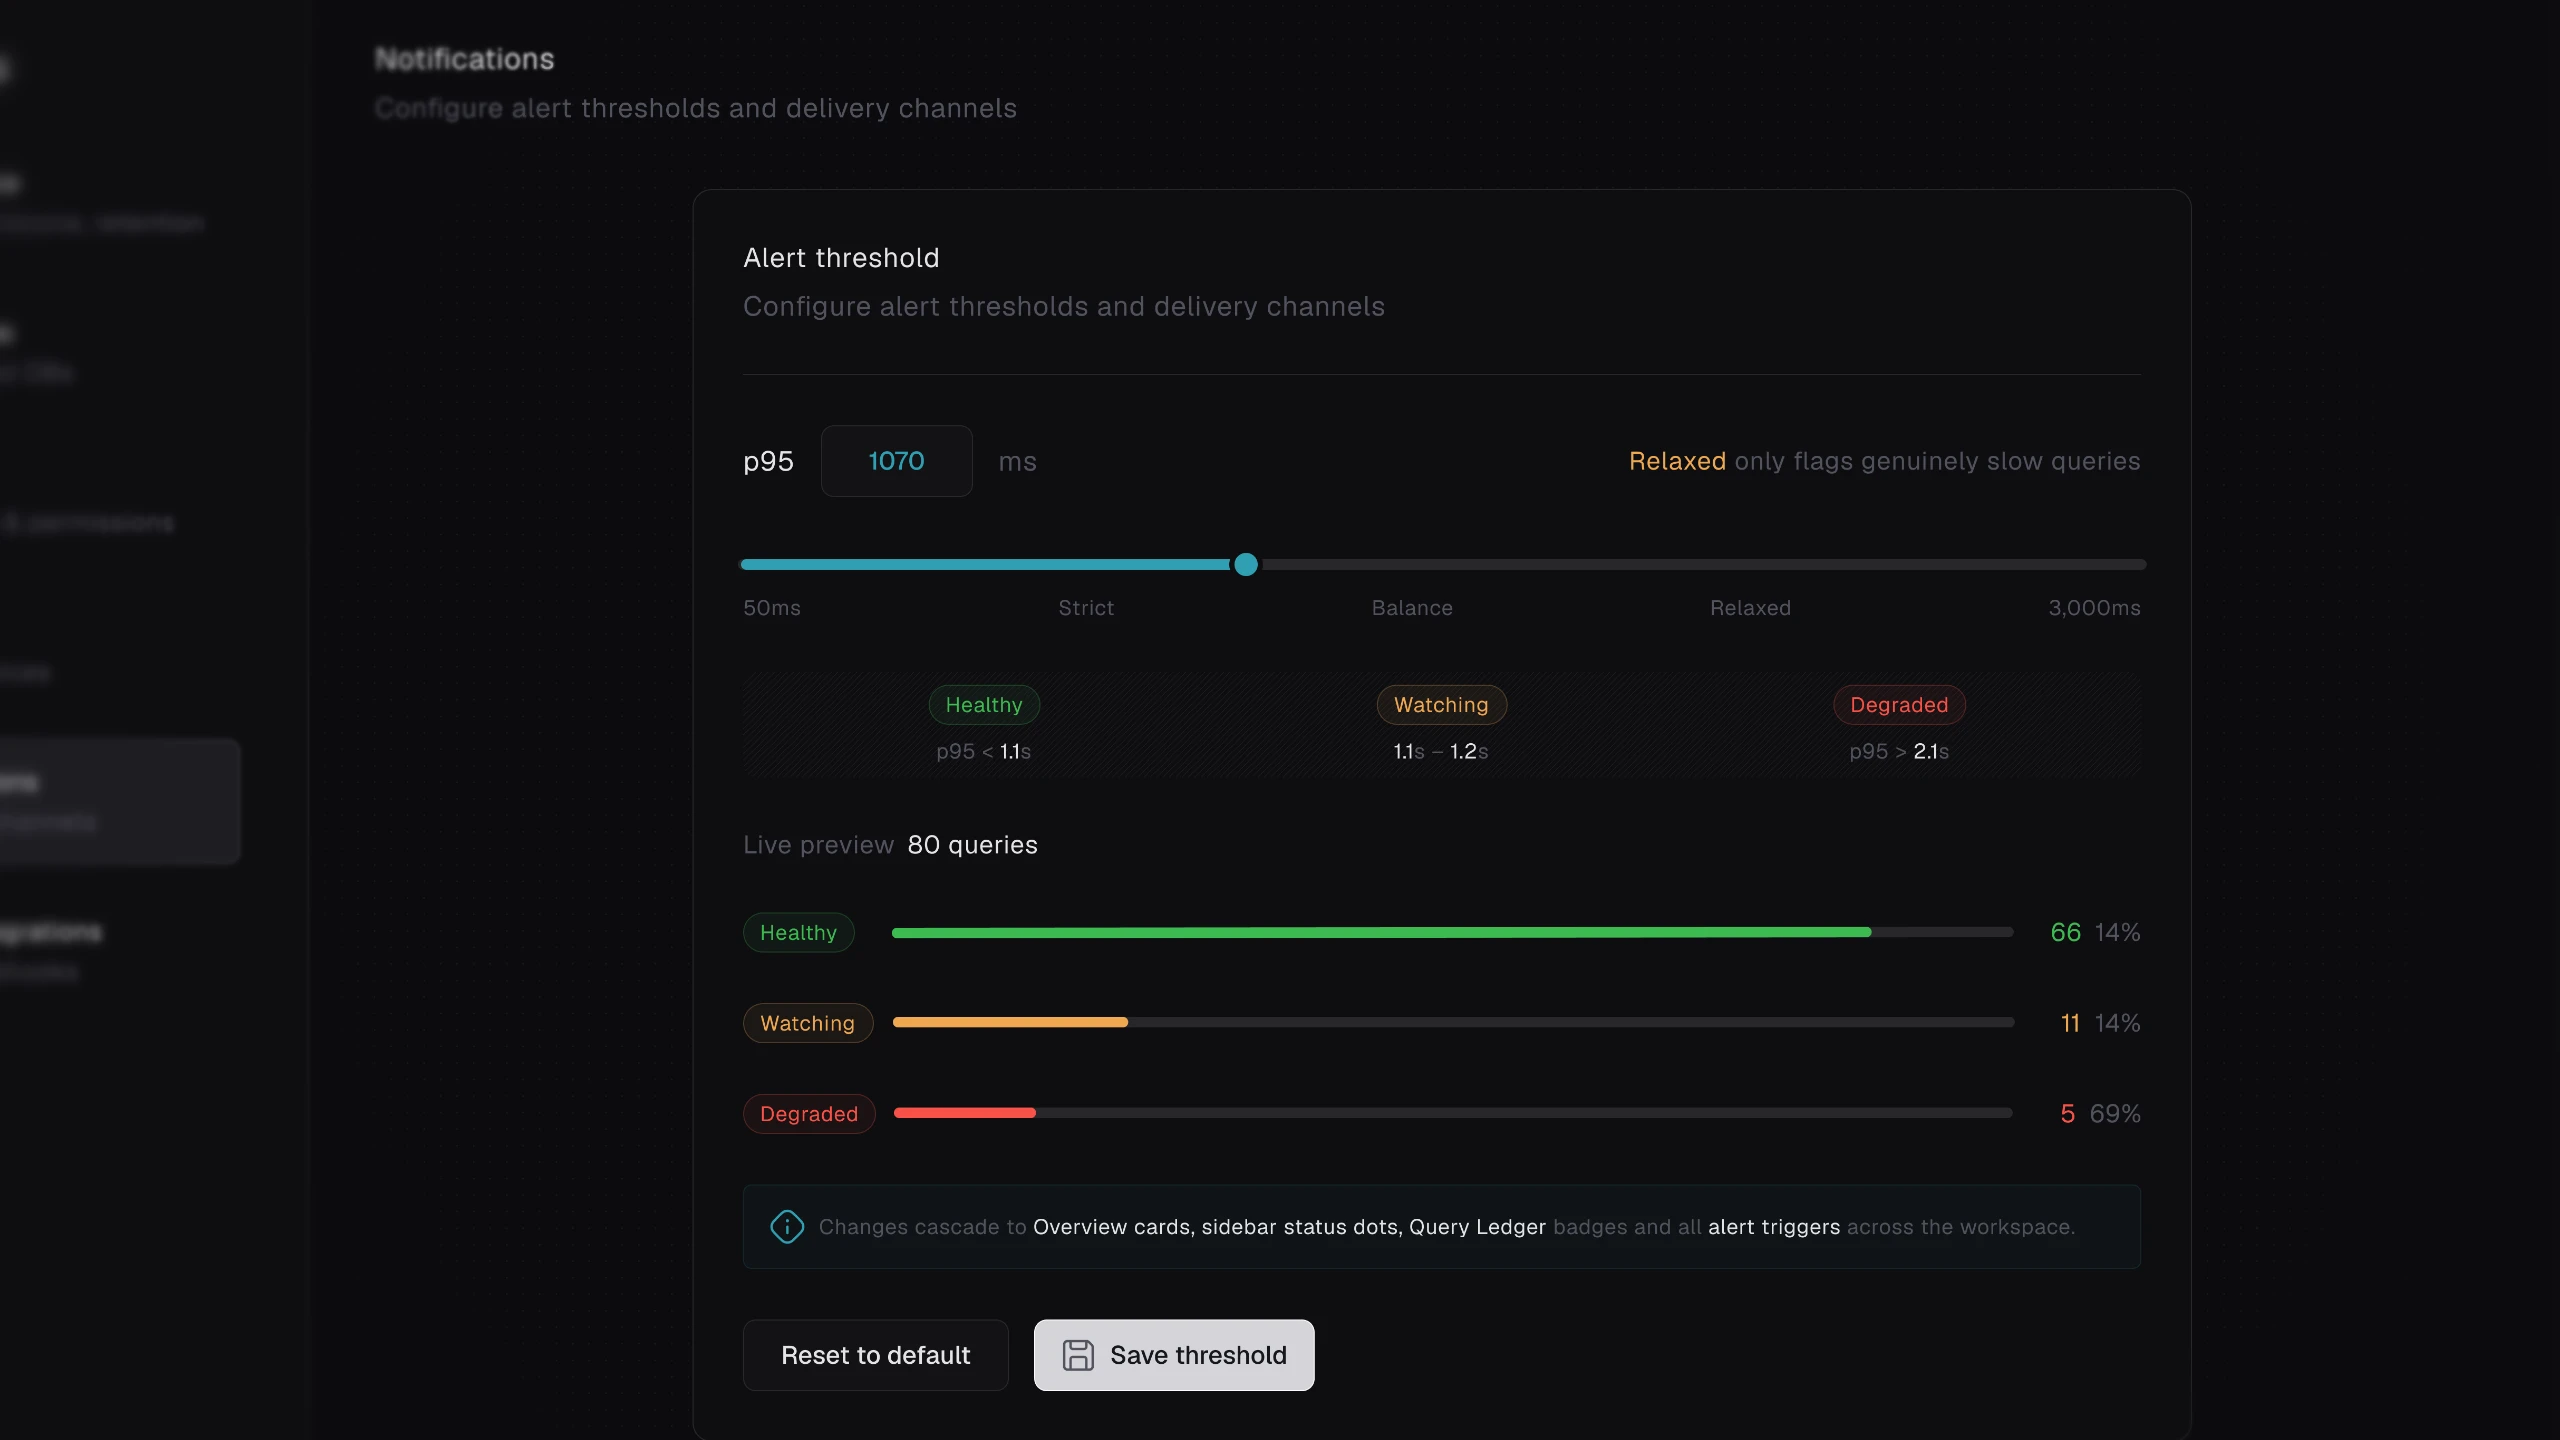
Progressive inspection
Detailed information lives inside a shared slide-over panel accessible from multiple entry points. Users learn a single interaction pattern regardless of where they enter the workflow.

A scalable component system
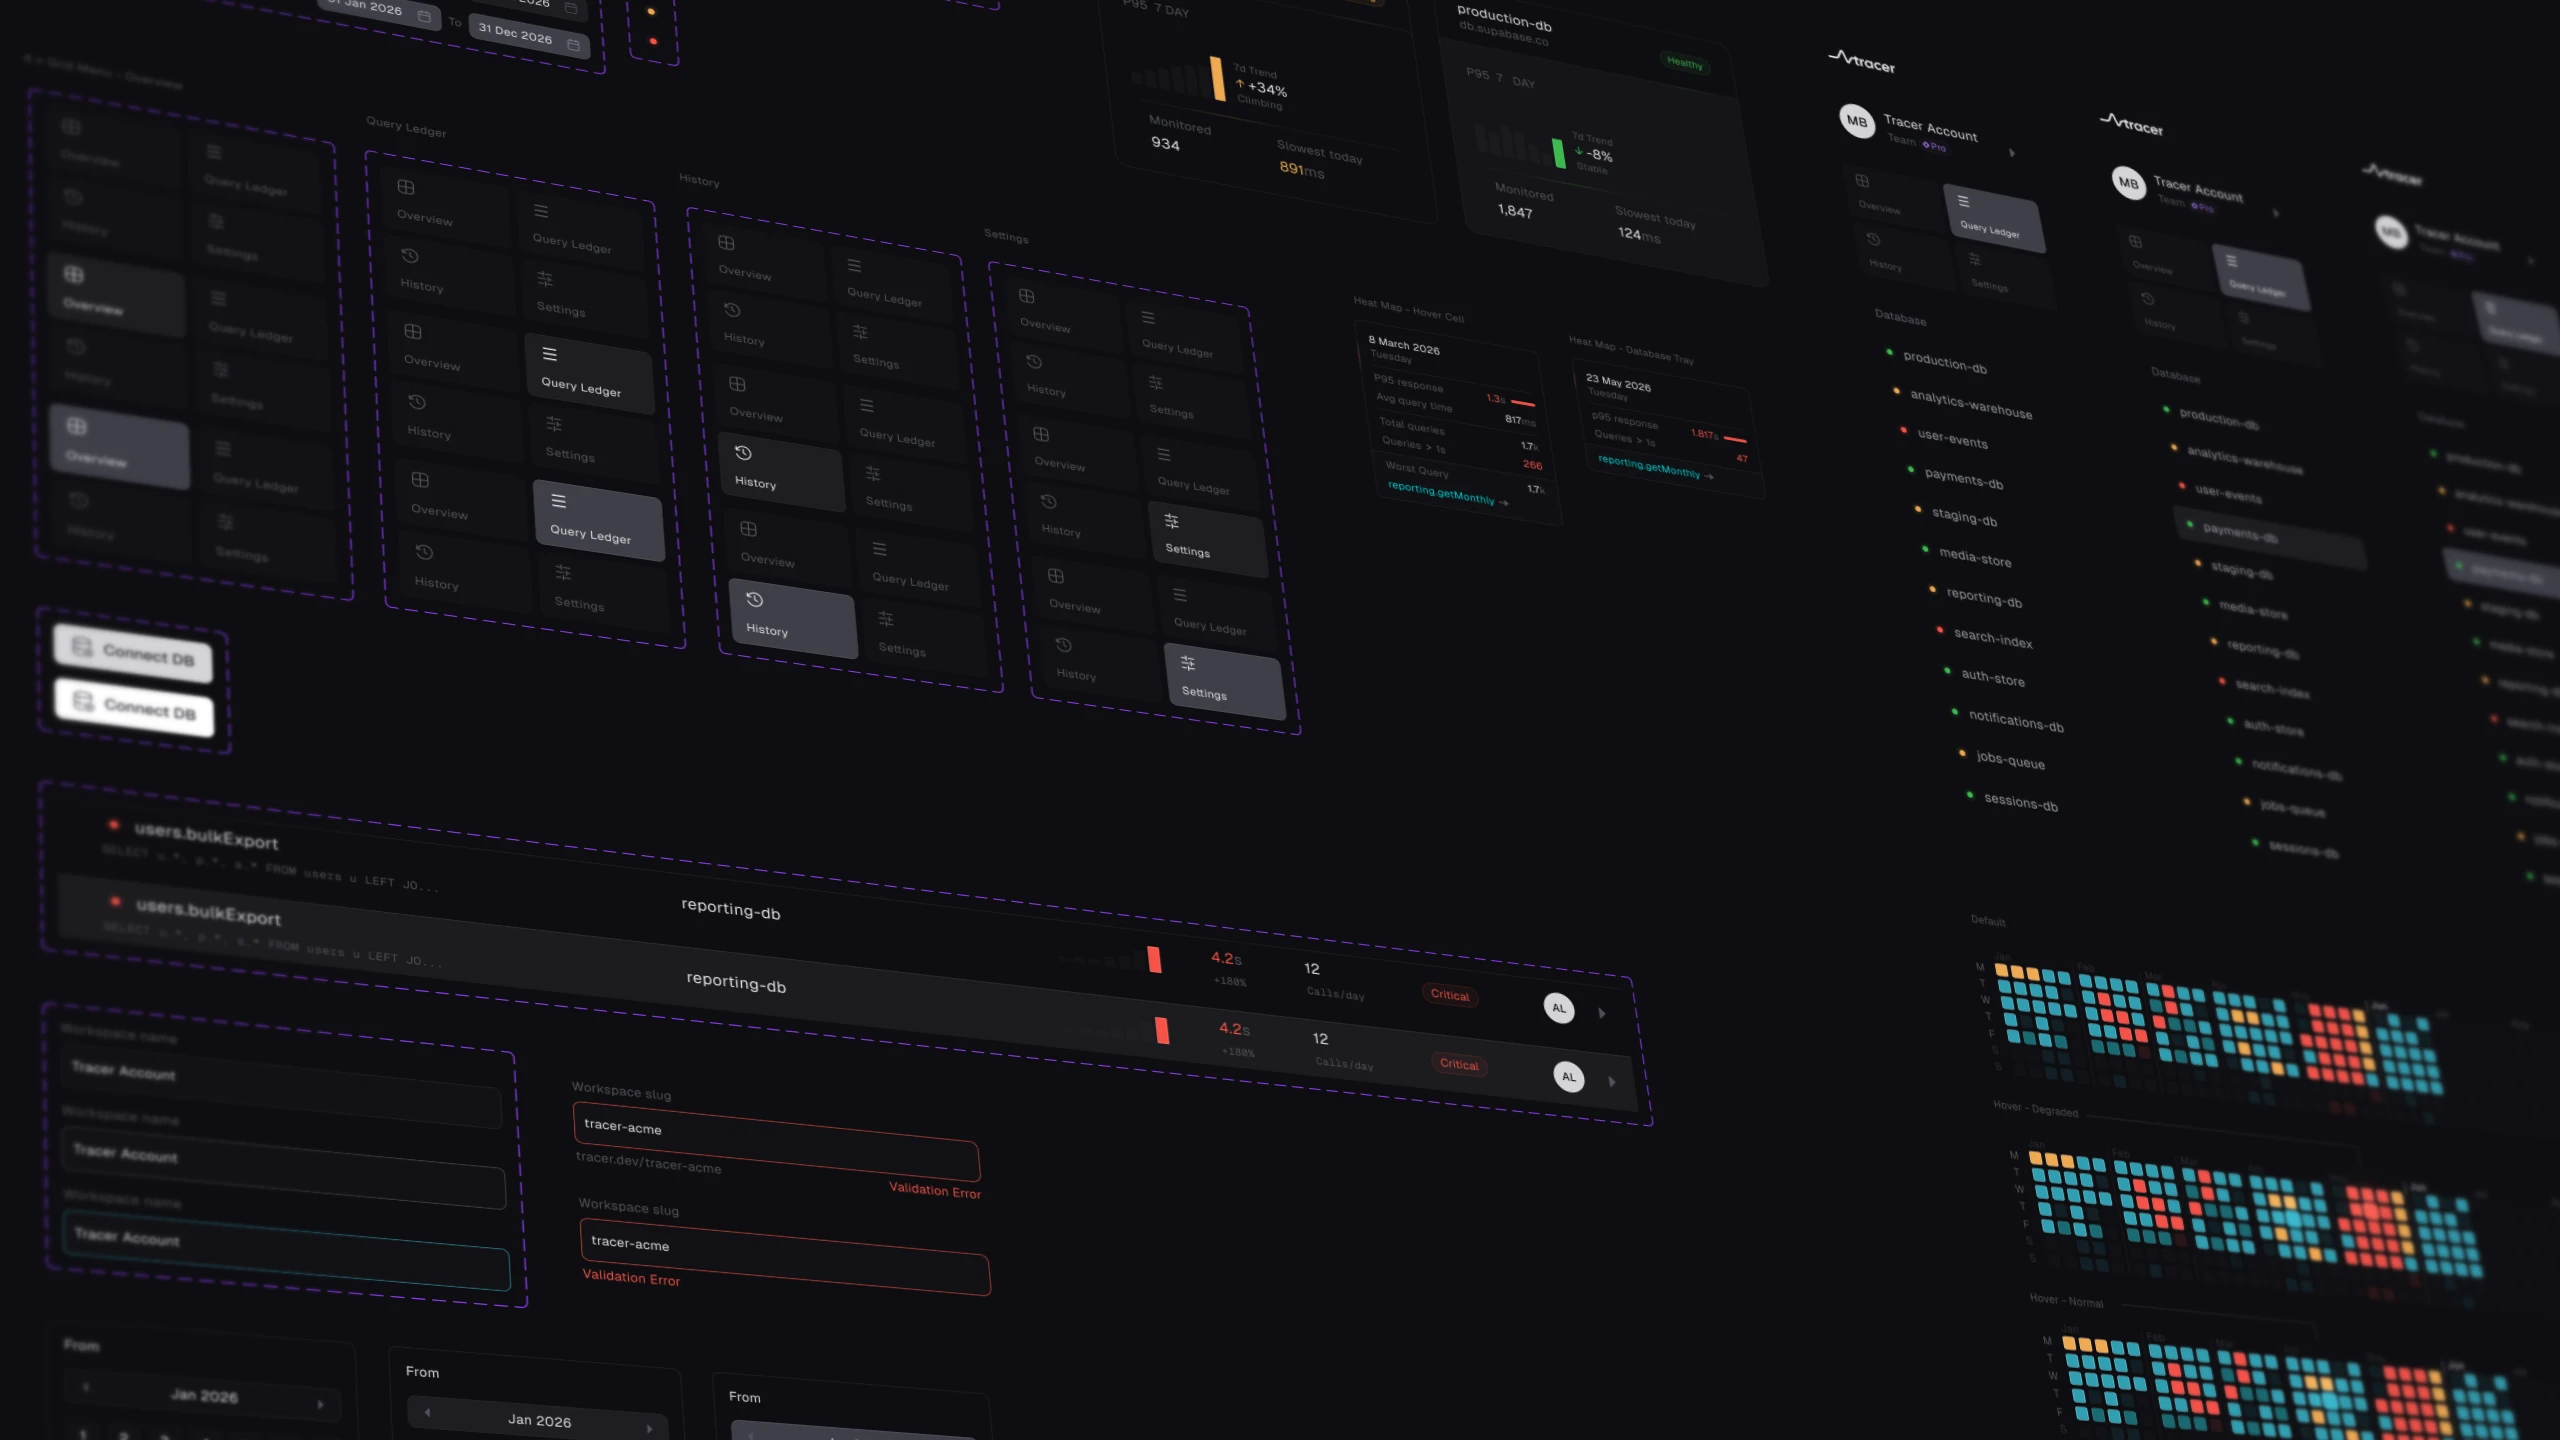
Reusable components, spacing rules and interaction states were designed together to ensure future views could be added without introducing inconsistency.

Scaling the system
Consistency wasn't a visual exercise.
It was an interaction strategy. Shared components, spacing, hierarchy and behaviour created a system that allowed new workflows to be introduced without changing how the product felt to use.
Outcome
Tracer demonstrated that complex observability tooling doesn't need to sacrifice clarity for depth. By restructuring information around engineering workflows rather than isolated dashboards, performance data became easier to scan, understand and investigate.
What Shipped
Complete component system
Interaction model
Design system foundations
Interactive prototype
In Development
Impact
Discussion around threshold modelling and workflow
Multiple commercial enquiries following publication
Validated demand for workflow-first monitoring interfaces
Reflection